Unify Your Tools in One Place
Too many apps, tabs, and spreadsheets? Let's build one clear dashboard so your team works faster and stays productive.
Schedule a Free CallTool Sprawl Slows You Down
Common signs your stack is messy. Do these sound familiar?
Constant tab switching, lost context, and duplicated work add up. Small delays stack into big slowdowns across the week.
Numbers in the CRM, billing, and spreadsheets don't line up. People argue about which sheet is "the real one."
Only a few people know where the data lives. When they're busy or away, decisions stall and work gets blocked.
Copy-paste and manual checks lead to mistakes. Fixing them takes time and hurts trust in the data.
💡 Teams of 5–10 often lose ~3–8 hours each week hunting data and switching tools. A single, trusted dashboard cuts that waste fast.
One Dashboard. One Source of Truth.
We keep what's working, cut what isn't, and connect the rest into one simple view your team can trust.
2–4 hours/week
Per person, from less tab switching, fewer clicks, and faster answers. Results vary by team and tools.
- Single search across customers, orders, and tickets
- Live data sync from your tools and databases
- Clear views: fewer tabs, fewer clicks, faster work
10–30% reduction
Less copy-paste and fewer manual checks mean fewer mistakes and more trust in your numbers.
- Same data shows everywhere (no more "which sheet?")
- Clear ownership and status on each record
- Audit trail to see who changed what, and when
What We Can Connect Into One View
Keep your favorite tools. We glue them together and present the important stuff in one place.
One page with customer profile, orders, invoices, support history, and notes.
See tickets, refunds, and payments together so agents resolve issues faster.
Live charts and alerts from your data sources so leaders get quick, clear signals.
Right people see the right data. Keep sensitive info protected and compliant.
APIs, webhooks, and direct DB reads (PostgreSQL, ArangoDB, etc.). Fewer manual exports.
Send weekly summaries to email or Slack. No more chasing spreadsheets.
Show Me! Don't Tell Me!
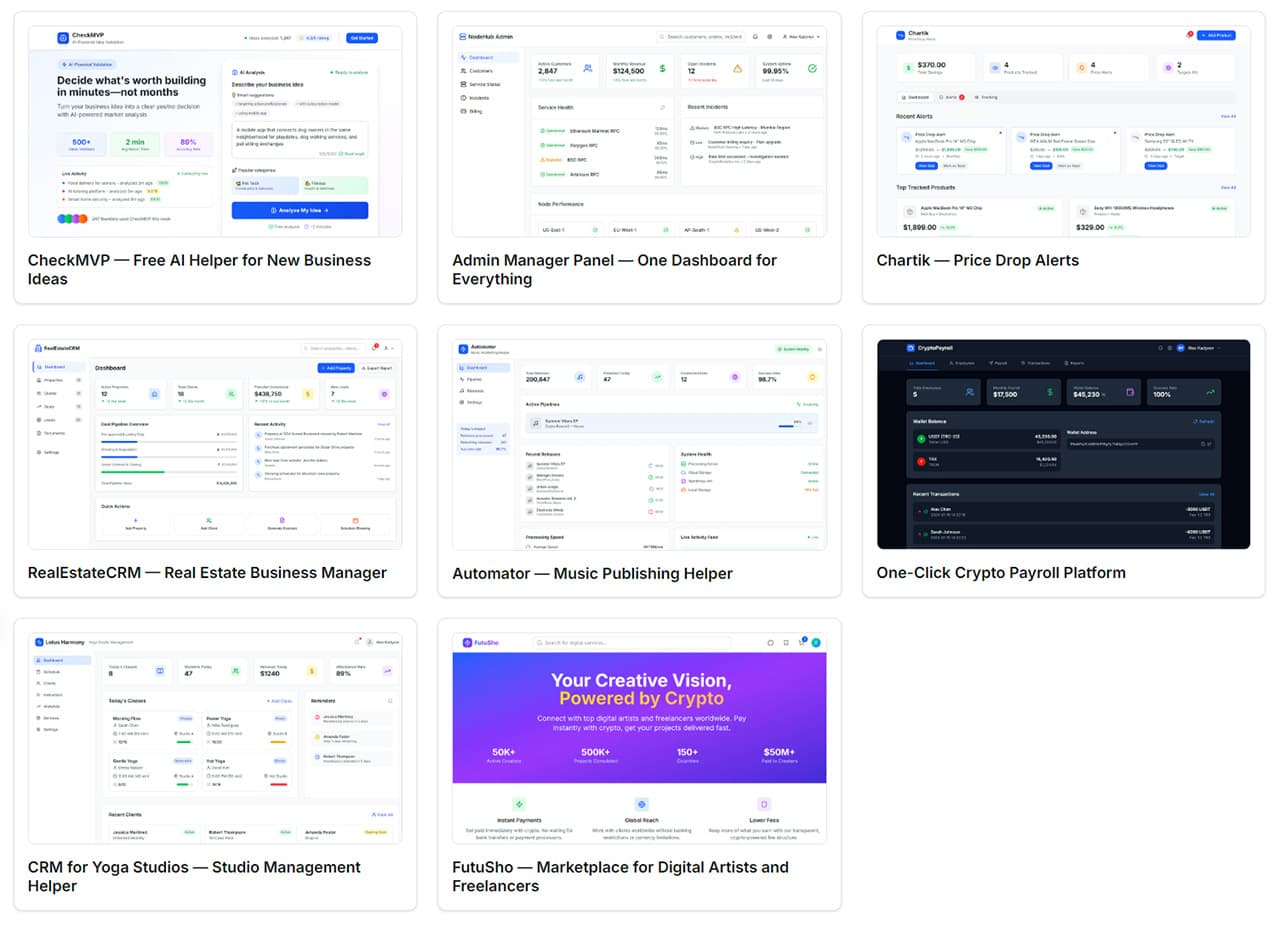
Here are examples of unified dashboards and connected views I recently built.
How It Works
From audit to launch, here's what we do to clean up your tools and data.
Stack Audit (30–45 minutes)
We list your tools, data sources, and key tasks. You show where time is lost and what a "good day" looks like.
Blueprint & Plan (2–3 days)
We decide what to keep, cut, and connect. You get a simple map, timeline, and clear scope.
Build the Dashboard (1–3 weeks)
I connect your tools, design clean views, and set up sync and permissions. You test before we go live.
Launch & Train (First month)
We go live, train your team, and make small tweaks. You get docs and a smooth handoff.
Why This Works
Simple, focused changes beat big, risky rebuilds—especially for small teams.
Keep, Cut, Connect
We don't start from zero. We keep what's good, cut noise, and connect the rest.
Simple to Use
One clean view your team understands on day one. Less training, more doing.
Own Your Data
Clear sources, audit trails, and exports. You're never locked in.
What Results Can You Expect?
Fewer tabs. Faster answers. Less stress.
2–4 hours
Better Data
Happier Team
Typical ROI Timeline
Most teams feel the lift quickly with a focused first version.
First unified views live; early wins and time savings
Team adopts the dashboard; fewer tabs and faster answers
Refinements and steady gains; add-ons as needed
Pricing
(Clear & Flexible)
Audit + simple fixes and recommendations
Connect 2–3 tools into one clear view
Multiple views and deeper integrations
*Pricing depends on complexity. Most small teams start with "Integration Fix."
Ready to clean up your tools?
Let's build one clear dashboard your team will actually use.